Election forecasting
Bayesian Analysis for Election Forecasting: A Case Study from Dataland
My recent work involves deploying a Hierarchical Bayesian model to forecast election results in a fictional country, Dataland, which resembles the UK’s first-past-the-post electoral system. Here is a high level overview of the methodological framework I developed, a deep dive on the details is provided in the README of the repo.
Introduction
Dataland, a fictional representation with 12 provinces and a multi-party system, is where this Bayesian analysis was applied. The model uses PyMC for prediction, drawing from Abramowitz’s “time for change” model and extending it to incorporate multi-party interactions and state-level nuances.
Methodological Workflow
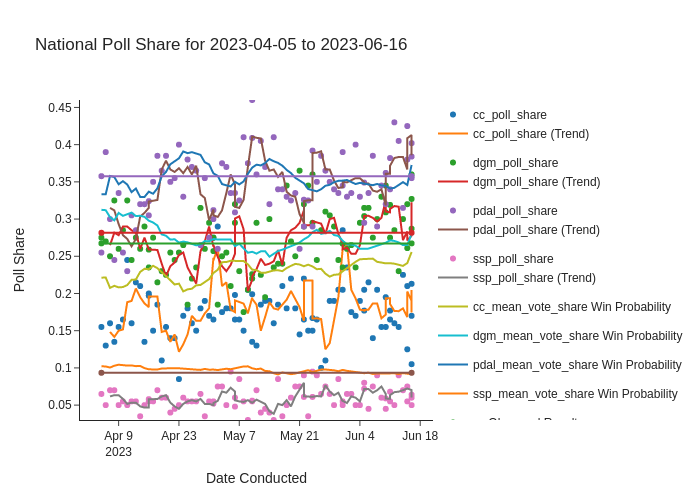
The Bayesian workflow was meticulously structured, starting with the calculation of state-specific partisan leans from historical vote share data. This was followed by integrating raw polling data and forecasting trends using a General Additive Model (GAM) applied to the polling predictions. The derived trend lines from this analysis can be seen below. Additionally, lagged economic indicators or “fundamentals” were processed to factor in the economic conditions influencing voter behavior.
Model Execution
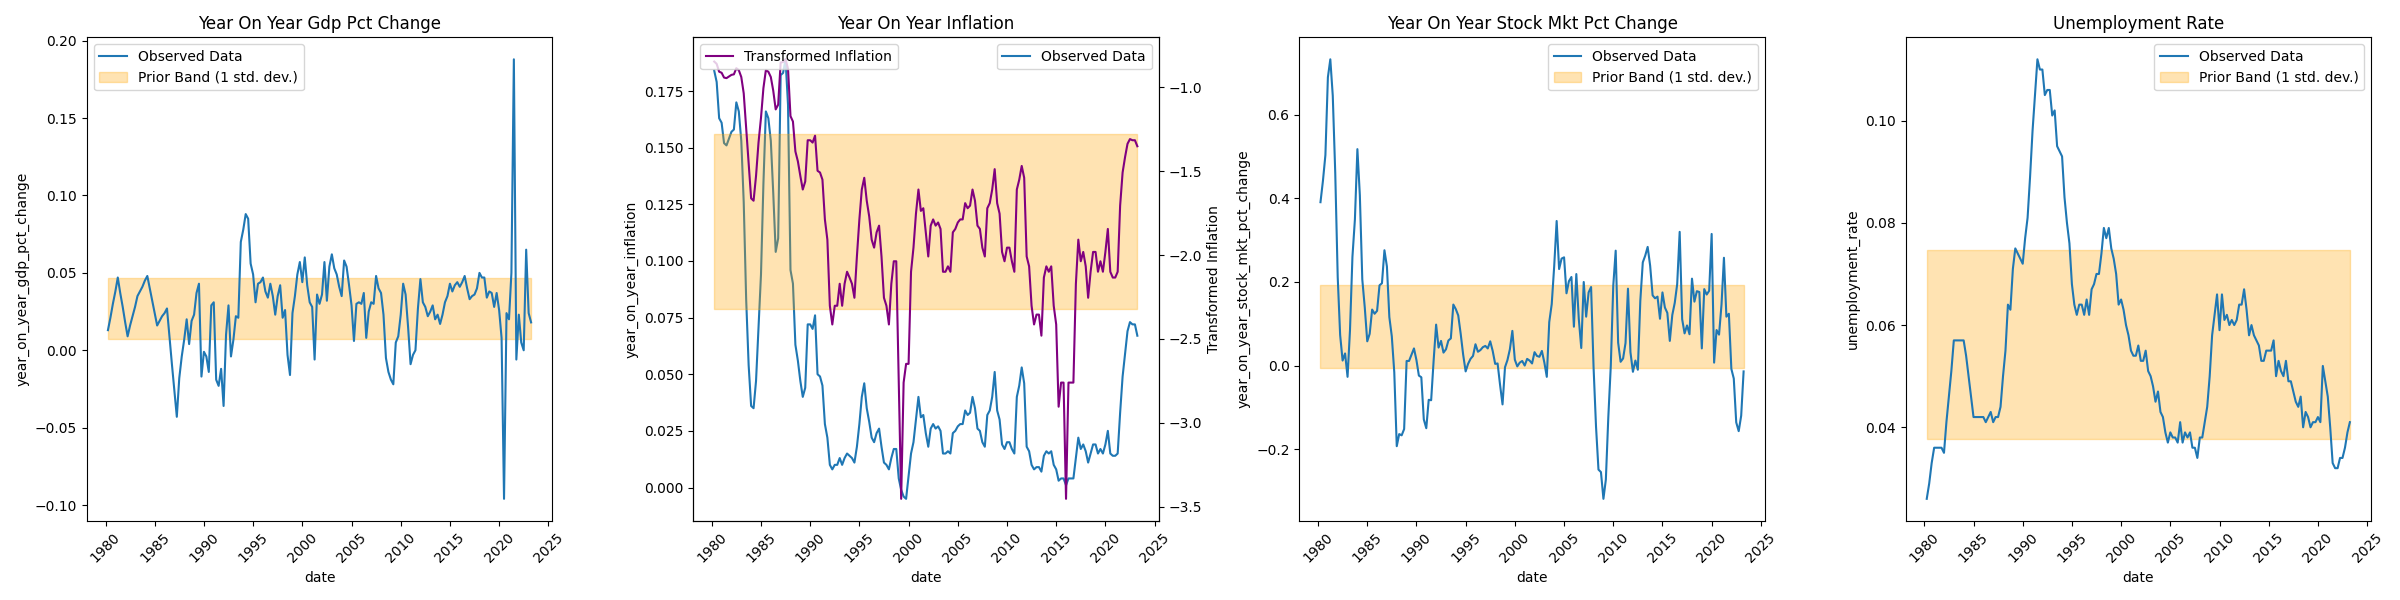
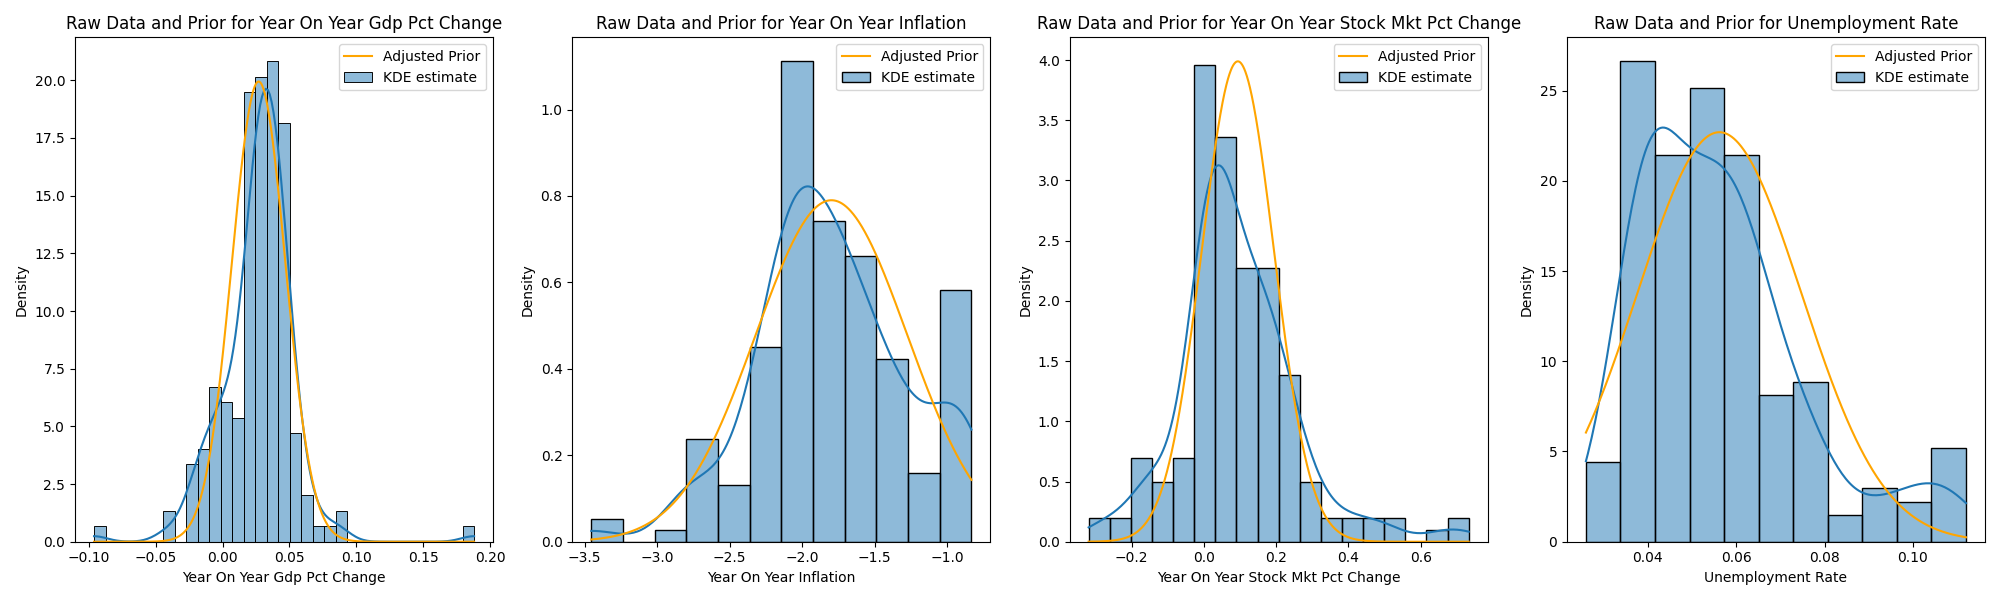
The DatalandElectionModel.py script is the crux of the forecasting model, combining lagged economic indicators, polling data, and historical partisan leans to predict vote shares. The model was carefully tuned to the peculiarities of Dataland’s political landscape, including inflation rates and GDP changes, to estimate the national vote share on election day.
Data Processing and Model Refinement
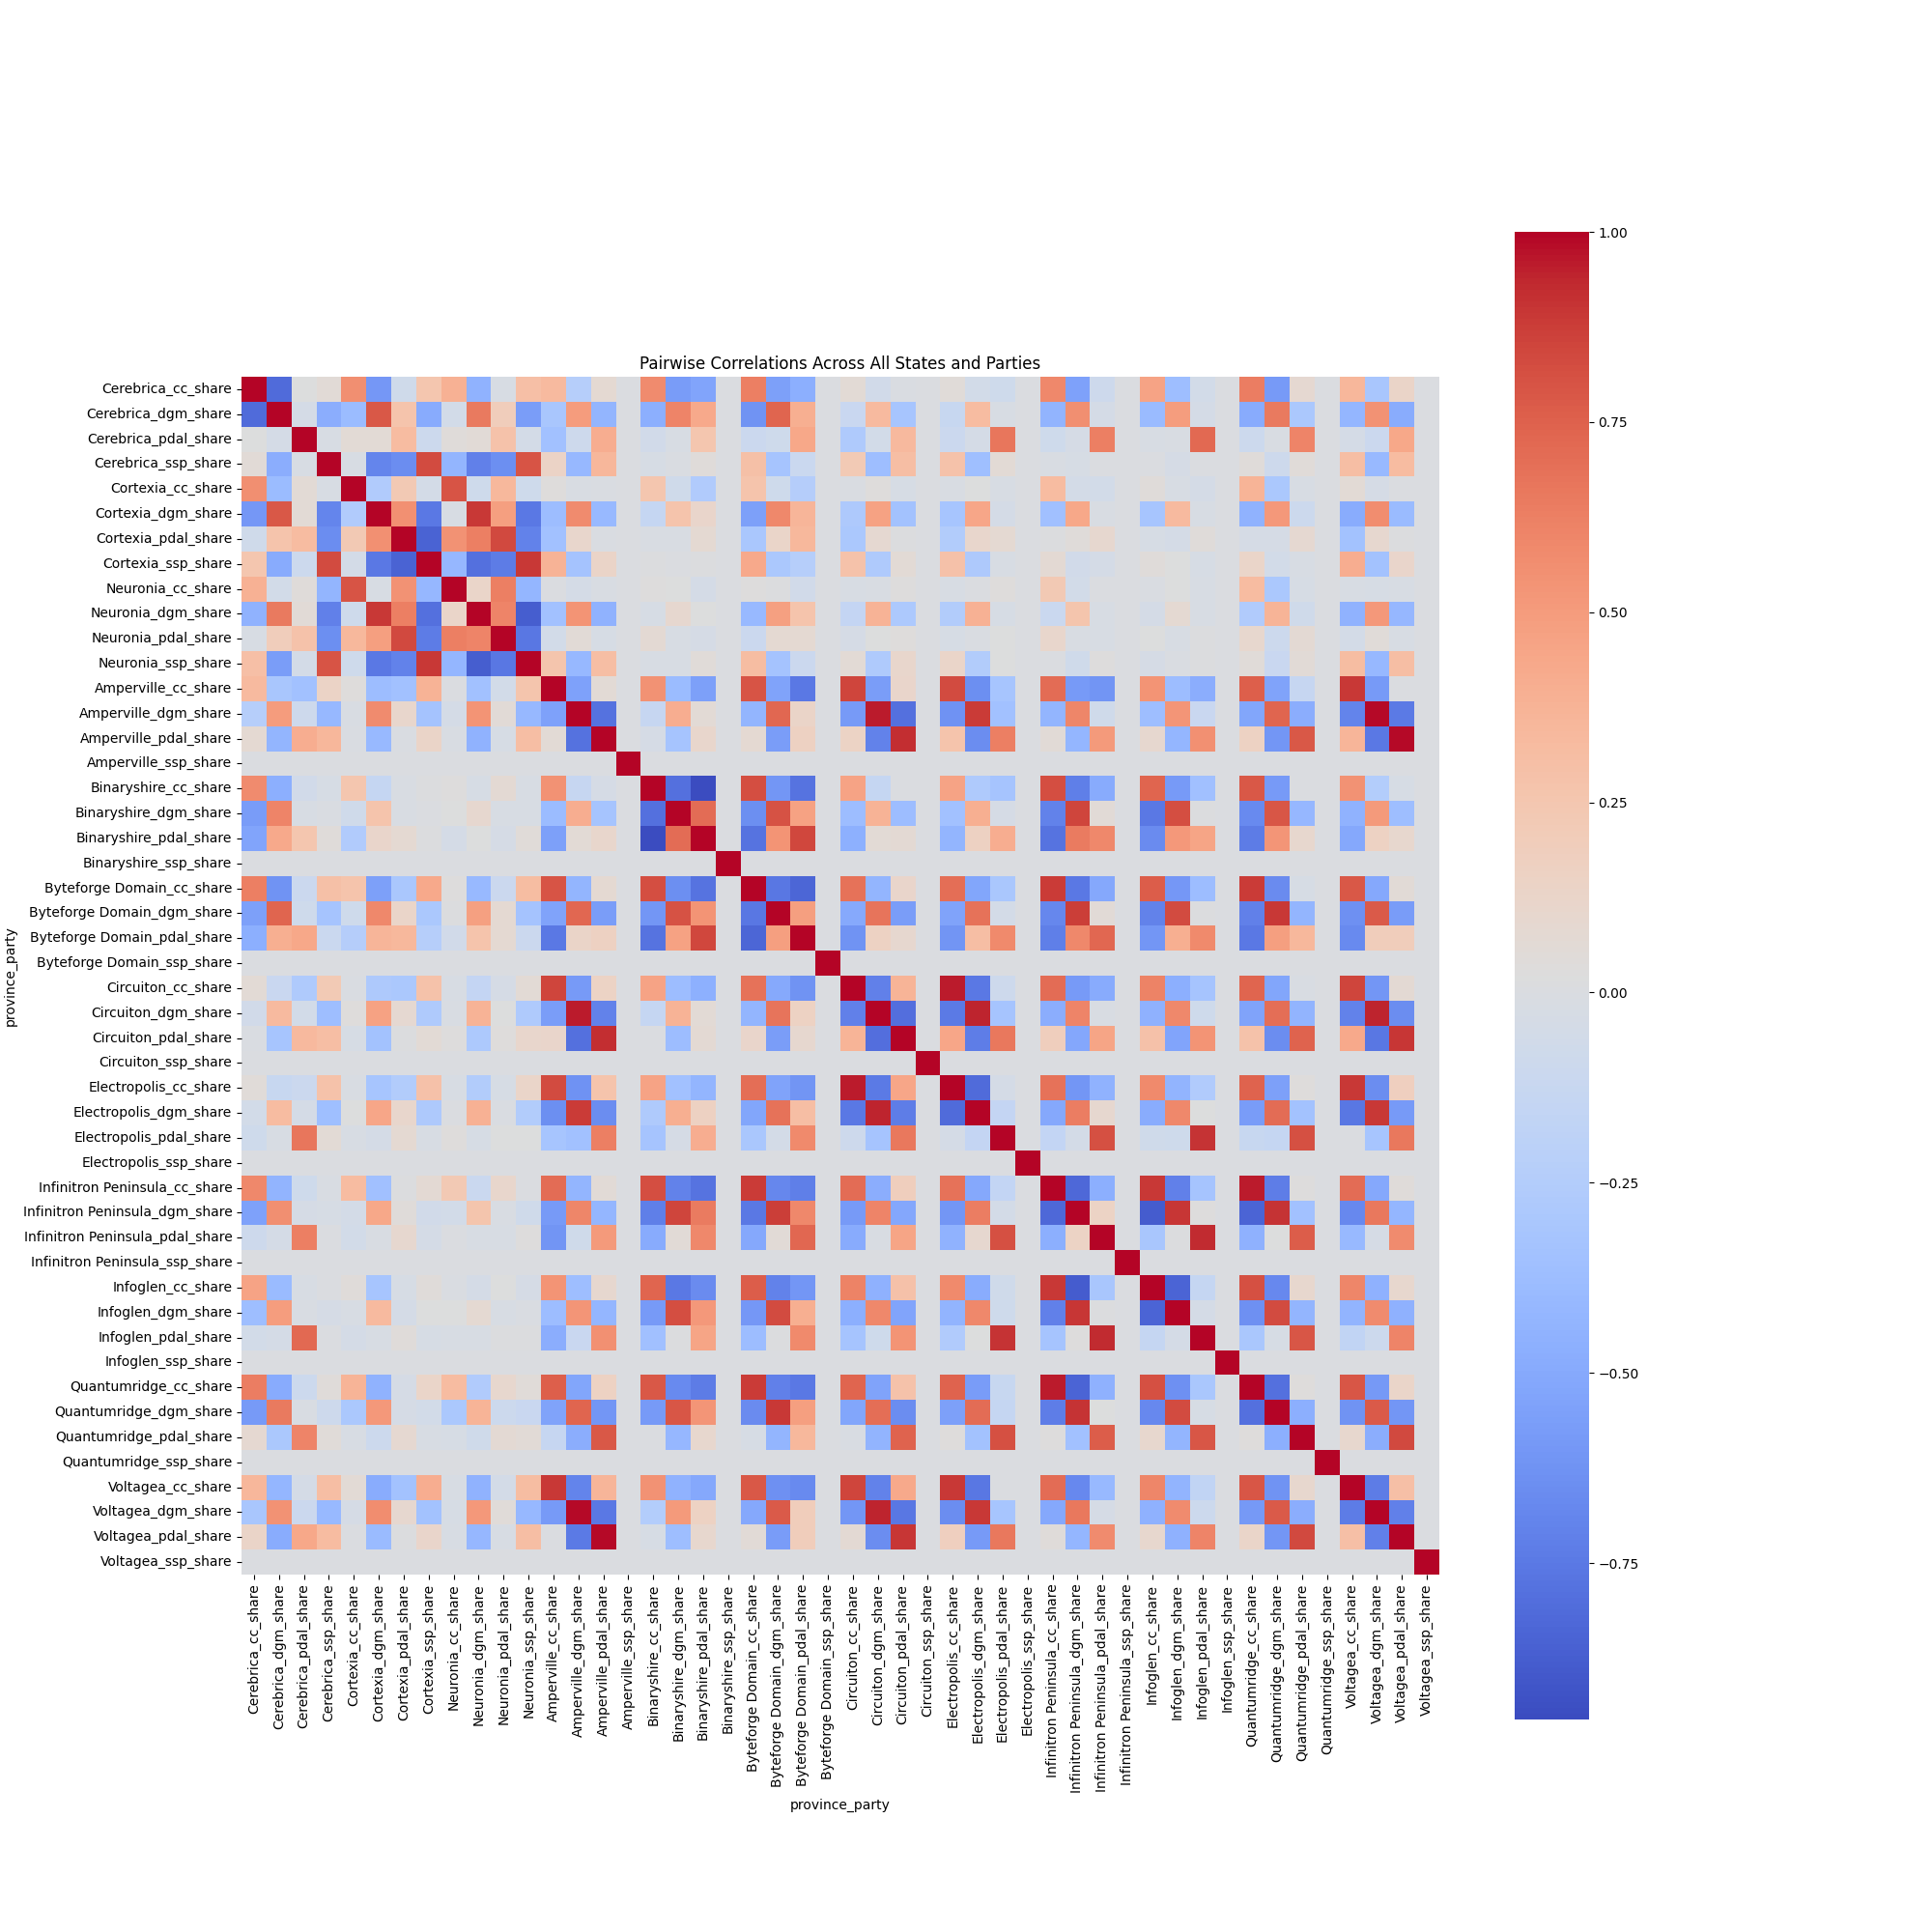
Data processing involved calculating the exponentially weighted sum of past partisan leans to create a current lean matrix. Additionally, the effect of pair-wise correlations across similarly inclined voting blocks was considered, as seen below. Polling trends were calculated using a weighted 7-day moving average, with pollster-specific weightings to mitigate bias. Time series forecasting was developed in a custom-built analysis package, and the model’s predictive performance was gauged against economic indicators using Bayesian methods.
Results and Visualization
The Bayesian analysis culminated in state-specific win probabilities and national-level projections, which were then parsed through a simulated Electoral College system to determine the overall election winner. The averaged results of this process for the 2023 election are shown below.
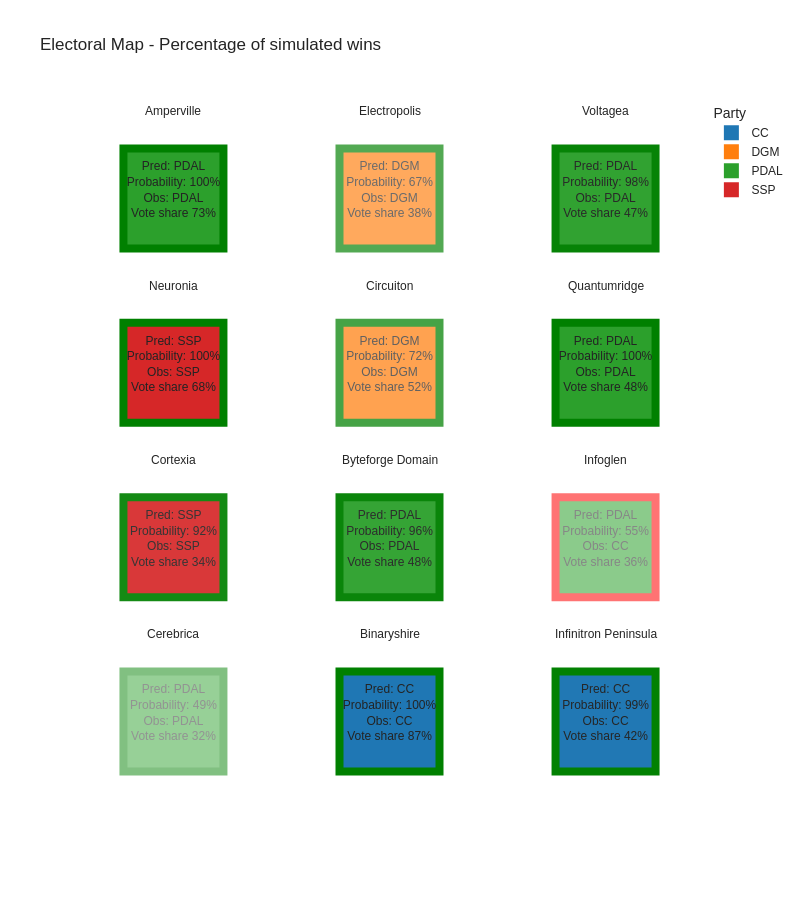
The model’s accuracy was demonstrated through various visualizations comparing predicted and actual results, underscoring the tool’s robustness.
Concluding Remarks
This project served as an interesting deep dive into both political science, as well as Bayesian inference, and was a useful sandpit for developing new ideas in both of these spaces.
Whether you’re a fellow data scientist, a political analyst, or simply a curious mind, I invite you to explore the repository, peruse the documentation, and perhaps, suggest improvements to the project.